In this article, you will get a solid introduction to Microsoft Power BI. Among other things, we will answer the following questions:
- What is Microsoft Power BI?
- How does it work?
- Is Power BI the right tool for you?


In this article, you will get a solid introduction to Microsoft Power BI. Among other things, we will answer the following questions:
Already know the basics of Power BI?

Microsoft Power BI is a business intelligence (BI) and data visualization platform that connects to multiple data sources (Excel, ERP, databases, cloud apps), transforms raw data, and turns it into interactive dashboards, reports, and KPIs you can share securely across your organization. Users can filter, drill down, and explore data in real time—without exporting to endless spreadsheets.
Imagine you’re a finance manager with sales in an ERP, budgets in Excel, and webshop orders in the cloud. Instead of chasing files and stitching them together, with Power BI you simply connect those sources once and open a live dashboard that auto-refreshes. You have your insights right on hand — no attachments, no version confusion — just answers.
Business Intelligence (BI) is the practice of turning raw data into answers you can act on. It covers the full journey — collecting data from different systems, shaping it into a consistent model, and presenting it as clear dashboards that explain what happened, why it happened, and what to do next.
The value of BI is focus and speed. When everyone sees the same, up-to-date metrics, meetings shift from debating numbers to deciding actions. Controllers close faster, managers spot trends earlier, and teams align on goals because KPIs are defined once and reused everywhere.
The challenge is complexity. Data lives in many places — ERP, CRM, spreadsheets, webshops, and databases — each with its own definitions and timing. Manually stitching these sources together creates version conflicts, delays, and errors. Even small differences (e.g., how “Revenue” is calculated) can derail decision-making.
Power BI connects to multiple data sources, cleans and combines them, and gives you an interactive, governed layer for analysis. Instead of building one-off slide decks, you publish live dashboards that refresh on schedule and can be securely shared with the right people.
Out of the box, Power BI is read-oriented — great for exploring and visualizing data, not for writing changes back to your database (e.g., entering budgets, adjusting forecasts, or editing master data) directly inside a report. If you need that, the fix is simple:
add a Power BI writeback add-on. These apps let authorized users input data within the dashboard and securely persist it to the source system — ideal for planning, forecasting, and master data management — without breaking governance.

The short answer: Power BI is for anyone who needs a clear, consolidated view of their data. Whether you’re running a small business from spreadsheets or managing complex enterprise systems, Power BI adapts to your needs and scales as you grow.
For smaller organizations, it’s often the first step into professional analytics. Instead of chasing multiple Excel files, Power BI connects everything in one place, giving you a live overview of sales, expenses, and performance without extra IT overhead.
For larger enterprises, Power BI fits into more complex setups — integrating with ERP systems, data warehouses, and cloud services. It provides governance, security, and scalability, while still allowing individual teams to build and share dashboards that matter to them.
It’s not just for analysts. Finance teams can track actuals vs. budgets in real time, managers can drill into performance by region or product, and executives can monitor KPIs across the organization on a single dashboard. Even frontline employees benefit when they can check today’s sales, productivity, or service levels in just a few clicks.
The strength of Power BI is that it serves both the creators of reports and the consumers of insights. Analysts and controllers prepare the data and define the logic, but everyone else — from the CFO to a store manager — benefits from the same trustworthy numbers. This means fewer debates about whose spreadsheet is correct, and more time aligning around the right decisions.
In essence, Power BI is for anyone — regardless of role or company size — who wants to replace scattered data with a
single version of the truth.
For teams that live and breathe numbers — like finance, controlling, and FP&A — Power BI dashboards can be a game-changer. Instead of juggling spreadsheets, slide decks, and emailed updates, you get a single interactive dashboard that refreshes automatically and brings all your KPIs into one place.
A well-designed financial dashboard can track everything from revenue and costs to margin, cash flow, and budget variances. The real strength lies in how easy it is to explore: click on a month, region, or product line, and the entire dashboard updates instantly. This makes reviews faster, and it helps teams move from simply reporting numbers to understanding the story behind them.
Visualizations make insights clear at a glance. A line chart highlights sales trends over time, a waterfall explains the movement in EBIT, and KPI cards show whether you’re on or off track. Instead of scanning rows in Excel, you can
spot patterns, anomalies, and opportunities immediately.
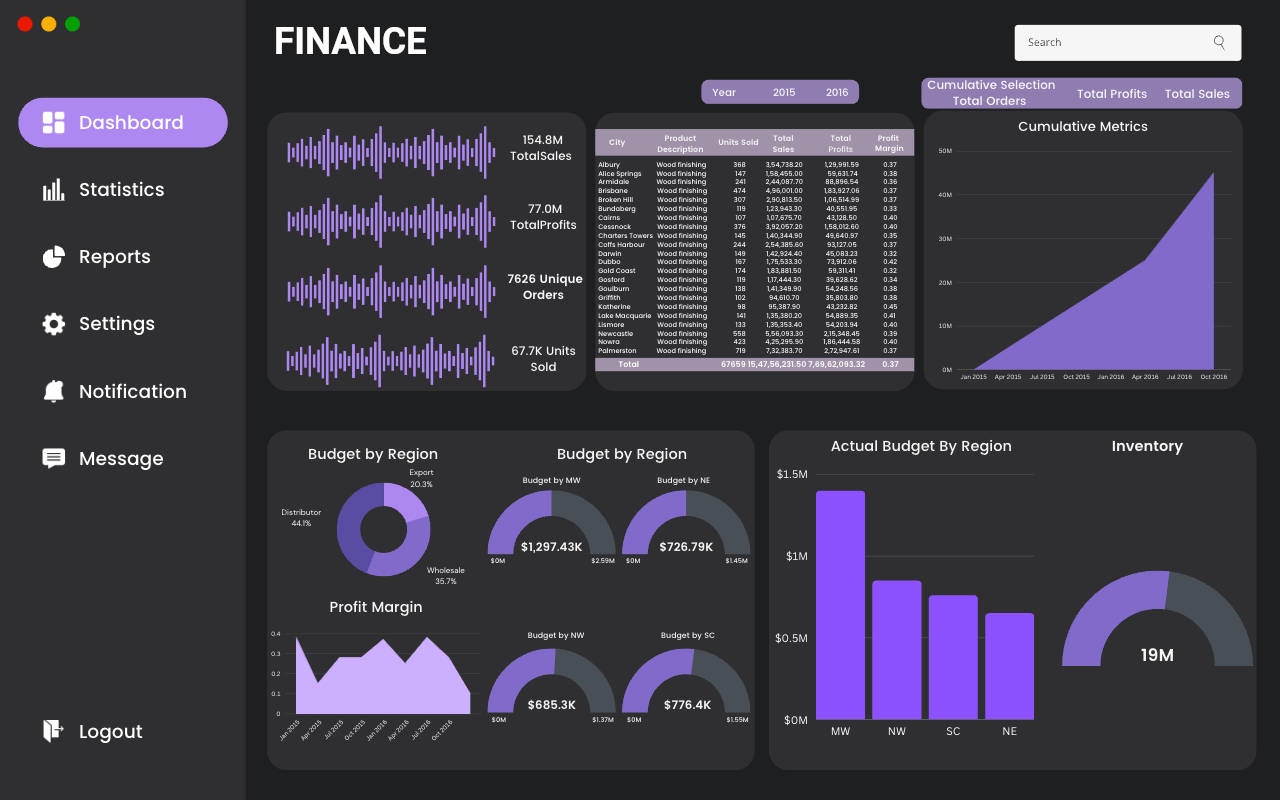
The screenshot illustrates how multiple perspectives — such as Actual vs. Budget, regional performance, or top expense categories — can live in a single, interactive view.
Example: Imagine your monthly performance meeting. Instead of walking through dozens of slides, the CFO opens a live Power BI dashboard. With one click, the team drills into Europe’s Q2 results, sees that Germany is driving most of the variance, and identifies a drop in margin tied to higher logistics costs. The discussion instantly shifts from “what happened?” to “what do we do next?” — all in the same meeting, without waiting for new reports to be prepared.
Although this example comes from finance, the same approach applies across the business: sales teams can track pipelines, operations can monitor supply chains, and HR can analyze workforce trends. Still, finance often leads the way — because when financial insights are clearer and faster, every part of the organization benefits.
For finance teams, this means less manual consolidation, fewer versioning issues, and more time for analysis and planning. In practice, Power BI doesn’t just make reporting prettier — it makes it faster, smarter, and more collaborative.
One of the reasons Power BI has become so popular is its flexible pricing model. Whether you’re an individual exploring data for the first time or an enterprise rolling out analytics to thousands of employees, there’s an option that fits.
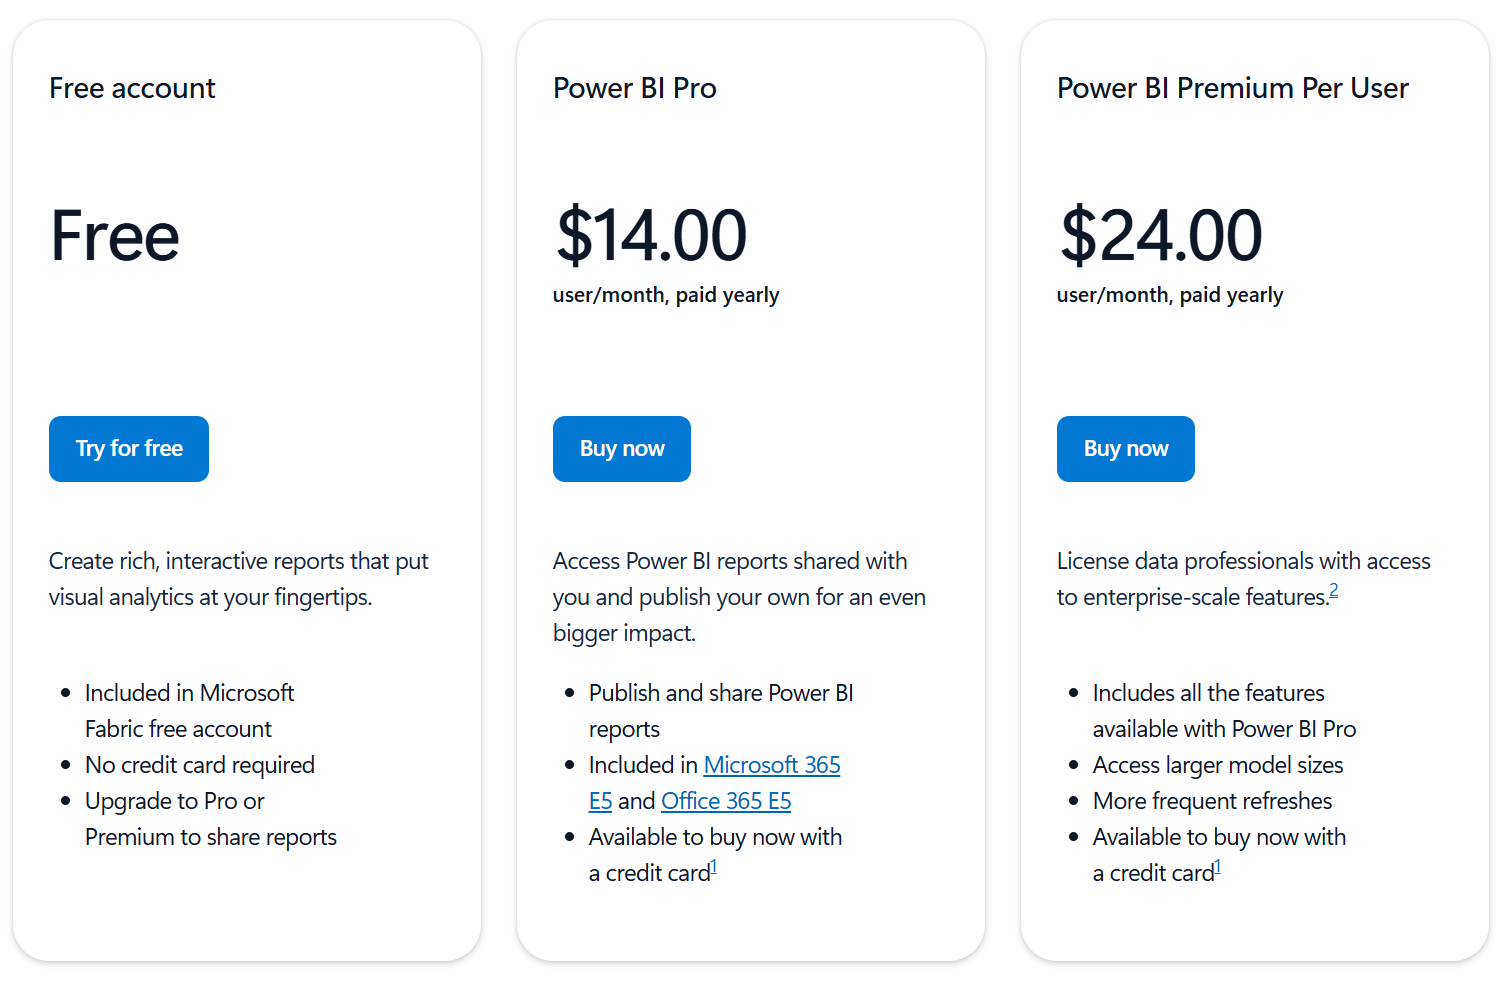
The free version of Power BI is ideal for individuals who want to get started. With Power BI Desktop, you can connect to multiple data sources, create models, and build interactive reports — all without paying a cent. The limitation is that you can’t share dashboards with others or use cloud collaboration features. It’s perfect for
personal use, testing out the platform, or building reports you later plan to share in a Pro or Premium environment.
Most organizations start with Power BI Pro. At a low monthly subscription cost per user, Pro unlocks the ability to:
Pro is designed for teams that want to move away from emailing spreadsheets and instead
rely on live, shared dashboards.
For larger organizations — or teams with big data needs — Power BI Premium provides enterprise-grade capacity. With Premium, you can:
Premium is the right choice when you need
scale, governance, and performance
— for example, when hundreds of managers across the globe need access to the same consolidated dashboards.
If you’re just getting started, the Free version is more than enough to explore Power BI and experiment with building reports. As soon as you want to collaborate and share dashboards with colleagues, Pro becomes the natural choice — it covers the needs of most small and medium-sized teams. For larger organizations, or for advanced users working with big and complex datasets, Premium provides the scale, performance, and flexibility required to support enterprise-wide analytics.
The best part is that you can
start small and scale up. Many businesses begin with Pro licenses and move to Premium once adoption spreads and reporting needs grow.

The good news is that getting started with Power BI is simple. You don’t need to be a data expert to begin — just a willingness to explore your data in a new way.
The easiest entry point is Power BI Desktop, Microsoft’s free Windows application. Here you can connect to your data (Excel, CSV, SQL, cloud apps, and more), clean and prepare it, and design interactive reports. Many users start here to learn the basics and experiment before rolling out dashboards to others.
Once you’ve built your first report, the next step is to publish it to the Power BI Service (the cloud platform at app.powerbi.com). This is where collaboration begins: you can share dashboards with colleagues, set up scheduled data refreshes, and manage permissions to ensure the right people see the right data.
Power BI isn’t limited to the desktop. With mobile apps for iOS and Android, managers and teams can check live dashboards on the go — whether in a meeting, on the shop floor, or during a client visit.
Microsoft offers a wide range of free learning resources:
As you and your team grow more comfortable, you may discover needs that go beyond analysis and reporting — like budgeting, forecasting, or master data management. Since Power BI on its own is read-only, this is where writeback add-ons come in, allowing you to input and update data directly within your dashboards. Starting with the basics makes it easier to later expand into these advanced use cases.

Microsoft Power BI has become one of the most widely used business intelligence tools for a reason. It makes it easy to connect different data sources, clean and consolidate them, and present the results in interactive dashboards and reports that anyone in the organization can use. For finance teams, this means faster reporting cycles and more time spent on analysis. For managers and executives, it means having reliable KPIs at their fingertips to guide decisions.
The real value of Power BI lies in its ability to replace scattered spreadsheets and disconnected reports with a single version of the truth. When everyone works from the same data, conversations shift from “which number is correct?” to “what action should we take?”.
That said, it’s also important to recognize Power BI’s main limitation: it is a read-oriented tool. While it excels at analyzing and visualizing data, it doesn’t allow you to write back changes — like entering budgets, updating forecasts, or editing master data — directly inside reports. For many organizations, this creates a gap between reporting and planning.
The good news is that this gap can be closed with Power BI writeback add-ons. These apps extend Power BI beyond visualization, allowing teams to input data directly into dashboards while keeping everything secure and integrated with the underlying database. For finance and planning teams, this means the same place you review numbers can also be the place you update them.
In short: Power BI is the ideal foundation for modern business intelligence, and with the right add-ons, it can become a powerful platform for planning and decision-making as well. Curious about the flexibility and value writeback provides?
No, not out of the box.
In order to display new data in your Power BI visuals, you have to input/update the data in your source system (outside of Power BI).
However, it is easy to install a Power BI add-on that allows you to update your data directly in Power BI (eliminating the need to work in multiple systems). Read more about Power BI Writeback add-ons.
Microsoft Fabric has introduced a similar capability for translytical writeback, but it doesn't offer the same flexibility as a Power BI add-on (and requires a Fabric license). Read more about Microsoft Fabric Translytics.
The main differences between Power BI writeback add-ons and Microsoft's Translytical Task Flows are flexibility and ease-of-use.
Microsoft's own writeback solution is very basic. It is limited to single transactions with little functionality (text-based), and it requires advanced technical skills to setup.
On the other hand, the best Power BI add-ons provide flexible multidimensional tables for data input and are easy to set up.
Yes, Power BI has a free version!
However, the free version of Power BI doesn't come with access to the online Power BI Service, so if you want to share or collaborate on reports, you have to upgrade to a paid tier.

Mikael Iuel-Brockdorff, CEO & Founder at accoTOOL.
With 25+ years in Business Intelligence, Mikael is an expert in reporting, budgeting, and bridging business and tech. He’s passionate about data-driven decision-making and a specialist in writeback from semantic models - an area where business needs meet cutting-edge innovation. Connect on LinkedIn or contact Mikael here.