Real-Time Analytics for Operations
Operations teams rarely struggle from a lack of data. The real issue is timing. By the time a report is refreshed, reviewed, discussed, and turned into action, the situation on the floor, in the supply chain, or in the service queue may already have changed.
That is why real-time analytics has moved from a nice-to-have capability to a practical operating requirement. When live metrics, alerts, and writeback actions sit in the same decision loop, teams can move from passive reporting to active control. That shift matters in finance, manufacturing, logistics, retail, energy, and customer operations just as much as it does in classic IT monitoring.
Why real-time analytics changes operations decisions
Real-time analytics gives operations teams a current view of what is happening now, not just what happened earlier in the day. In Microsoft’s terms, a real-time dashboard can present an up-to-the-second snapshot of goals and data points, while real-time streaming updates dashboards as new data arrives. That sounds simple, but the business effect is significant: a delay of even fifteen minutes can hide a line stoppage, an inventory issue, a missed service-level target, or a pricing exception.
Traditional BI still matters. Historical reporting, trend analysis, and variance reviews remain essential for planning and accountability. Real-time analytics does not replace those disciplines. It adds a faster operating layer that helps teams intervene while the outcome can still be influenced.
The strongest operating models use both views at once. Live signals tell people where to act. Historical data tells them whether the action worked, whether the pattern repeats, and where process changes are needed.
Real-time analytics vs historical BI in Power BI
Power BI can support several forms of time-sensitive reporting, but not all real-time data patterns behave the same way. Microsoft distinguishes between persistent data used for analysis and lighter streaming scenarios built for immediate visibility.
A push semantic model stores data permanently, which makes it useful when a team wants live-ish updates and later analysis in the same environment. A streaming semantic model stores data temporarily, which can work well for fast-moving status views where long-term retention is not the goal. Microsoft also states that creation of new real-time semantic models, including push and streaming models, will no longer be supported after October 31, 2027. That matters for architecture planning today.
This point is easy to miss: a live dashboard alone is not an operating system for the business. If a metric changes and the user still has to open email, switch to a spreadsheet, or ask IT to update a field, the response cycle remains slow.
Real-time analytics becomes much more valuable when insight and action are connected.
Where operations teams gain the most from real-time analytics
The best use cases share a common pattern. Data changes quickly, the business impact is immediate, and people need to intervene before the next scheduled refresh.
Common high-value scenarios include:
- Production line status
- Inventory exceptions
- Transport and route delays
- Order backlog monitoring
- Store or site performance
- Financial close tracking
- Workforce scheduling gaps
- Service queue management
These are not just dashboarding exercises. They are coordination problems. A planner may need to reallocate supply. A controller may need to adjust a forecast. A supervisor may need to comment on a deviation and assign follow-up. A master data owner may need to correct a code or ownership field that is blocking downstream activity.
That is where many analytics projects either stall or succeed.
Operational workflows need writeback, not only dashboards
A mature operations function does not stop at seeing a problem. It records a decision, updates assumptions, captures context, and feeds the result back into the system. In Power BI environments, that means writeback deserves the same design attention as visualization.
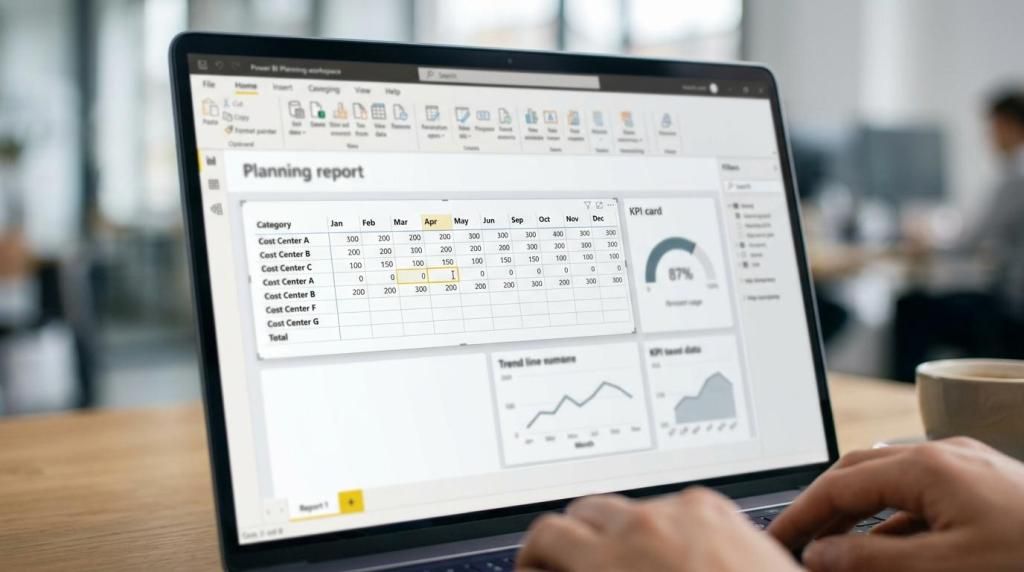
Writeback turns a dashboard from a monitoring surface into a working application. Users can edit values, submit comments, adjust plans, maintain master data, and write those changes back to SQL Server or another governed store. For organizations already invested in Microsoft Power BI, this approach can reduce the sprawl of spreadsheets and email chains that often sit outside the formal data model.
This is one reason native Power BI writeback tools have drawn attention from data, finance, and operations teams. accoTOOL, for example, focuses on grid-style editing, real-time database writeback, and reuse of existing Power BI models without requiring a special schema. Its product set spans planning, commenting, master data management, and writeback visuals, which fits the way operational work actually happens: review, decide, update, and track.
When teams connect live analytics with governed writeback, they create a much tighter operating loop:
- Detect: spot the variance as it appears
- Decide: update a plan, threshold, owner, or classification
- Document: capture comments and business context
- Persist: write the result back to a trusted database
- Review: compare current actions with historical outcomes
That workflow is much closer to how real operations run than a static dashboard refresh cycle.
Power BI architecture for real-time analytics in operations
Architecture choices matter because operational trust is fragile. If one team sees live numbers that disappear later, while another team expects retained history for audit or trend analysis, confusion sets in quickly.
For many organizations, the first design question is not “How real-time can we get?” but “What must remain persistent?” If a metric is only needed for a live wallboard, temporary streaming behavior may be enough. If the same metric should support daily reviews, root-cause analysis, and monthly planning, persistent storage becomes necessary.
Microsoft’s guidance helps frame the options. Push semantic models keep data permanently for historical analysis. Streaming semantic models are temporary. Microsoft also points users toward Real-Time Intelligence for up-to-the-minute insights and purpose-built real-time dashboards, especially for operational scenarios where speed and accuracy matter. That direction is worth serious attention given the 2027 retirement path for creating new real-time semantic models.
A practical architecture discussion usually comes down to four questions:
- Latency target: seconds, minutes, or near-real-time refresh
- Retention need: transient signal or historical record
- User action: read-only monitoring or direct writeback
- Governance model: departmental view or enterprise-controlled process
Those choices shape data pipelines, licensing, security, and user design. They also shape adoption.
Operations teams will accept a slightly slower update if they trust the number and can act on it in the same screen. They will reject a flashy live view if the number cannot be traced or the next step is still manual.
Governance keeps real-time analytics useful
Speed without governance creates noise. In operations, noise is expensive.
A live dashboard can show the same issue to ten people, but if status definitions, owners, and correction workflows are unclear, the response becomes fragmented. One person changes a spreadsheet. Another adds a note in Teams. A third updates the source system later. The metric may recover, yet nobody can explain why.
That is why strong real-time analytics programs define more than KPIs. They define ownership, approval boundaries, writeback rules, and comment standards. They also treat master data quality as part of operational performance, not a separate IT concern.
A disciplined setup often includes:
- Business ownership: clear responsibility for each live metric
- Writeback controls: who can edit, approve, or override values
- Commenting standards: short, searchable context tied to the data point
- Master data stewardship: controlled updates to dimensions and mappings
- Audit visibility: a record of what changed, when, and by whom
This is also where the idea of a single source of truth becomes practical rather than theoretical. If live metrics, comments, plans, and master data updates all sit in disconnected tools, trust erodes. If they are tied back to governed datasets and databases, the organization gets one operating record with much less friction.
Customer case material published by accoTOOL points in this direction. Public examples on its site include Whiteaway Group and PensionDanmark, and one published case reports reduced planning time and a cleaner single source of truth through its Power BI-based planning setup. The specific lesson is broader than any one vendor: the business value appears when teams stop bouncing between reporting and action systems.
A phased rollout for operations teams using Power BI
Many organizations make real-time analytics harder than it needs to be by trying to light up every process at once. A phased approach usually produces better results.
Start with a narrow operational decision that already has business urgency. Pick one workflow where delay is costly and where the next user action is easy to define. A plant exception queue, a sales and operations planning adjustment, or a daily cash or forecast variance process can work well. Then decide what the user should be able to do when the signal changes.
A strong first release usually includes three layers: live visibility, controlled action, and persisted history. That combination gives the team immediate value while keeping the model useful for later review and governance.
A sensible rollout path often looks like this:
- Choose one decision loop: focus on a process with clear ownership and measurable response time.
- Add live metrics: show the current state and threshold-based exceptions.
- Enable writeback: let users update plans, comments, or master data inside the workflow.
- Store history: retain enough data for trend analysis and audit needs.
- Expand carefully: reuse the pattern across adjacent processes after adoption is proven.
This approach is especially effective in Power BI estates because teams can build on models they already use. Tools that support native integration, SQL Server writeback in Azure or on-premises, and cloud or hybrid deployment can shorten the time between prototype and production.
What mature real-time analytics looks like in daily operations
The end state is not a wall of flashing tiles. It is a steady operating rhythm where current signals and recorded actions stay connected.
A planner adjusts a forecast in the same environment where the variance appears. An operations manager adds context directly next to the KPI instead of burying it in chat. A data steward updates a critical master data value without waiting for a separate development cycle. Finance sees the effect quickly, and leadership can review both the live picture and the history behind it.
That is a far more useful pattern than chasing “real-time” for its own sake. Fast data matters most when it helps people make better decisions, record those decisions properly, and keep the whole organization working from the same trusted view. For teams already committed to Power BI, that means thinking beyond dashboards and treating analytics, writeback, and governance as one operating system.